
Mapping informal waterfront settlements at risk of demolition
Mapping informal waterfront communities in the Niger Delta facing the threat of demolition.
An interactive dashboard mapping COVID-19 by state across Nigeria from 2020 to 2022, updated every day with data from the Nigeria Centre for Disease Control (NCDC).
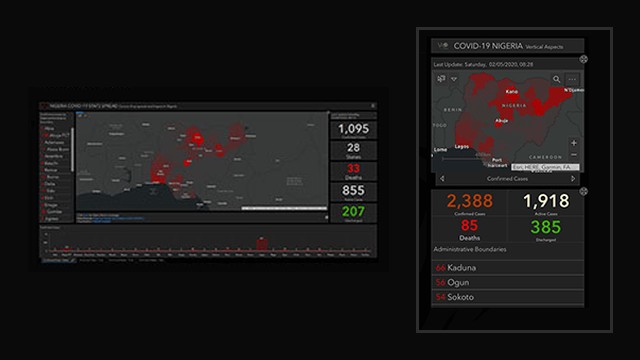
From 2020 to 2022 the NCDC provided its COVID-19 figures every day, and we incorporated each day's release into the dashboard. The map showed the situation in every state, and the trend line tracked the pandemic from its first months onwards.
The result was a running, state-by-state record of how the outbreak spread and changed across Nigeria.
Built on ArcGIS, the dashboard had desktop and mobile layouts. It showed confirmed and active cases, deaths, discharges and the number of states affected, with a daily timeline and a state-by-state list. On the map, a deeper red meant more confirmed cases in that state.
Mapping informal waterfront communities in the Niger Delta facing the threat of demolition.
 Social impact
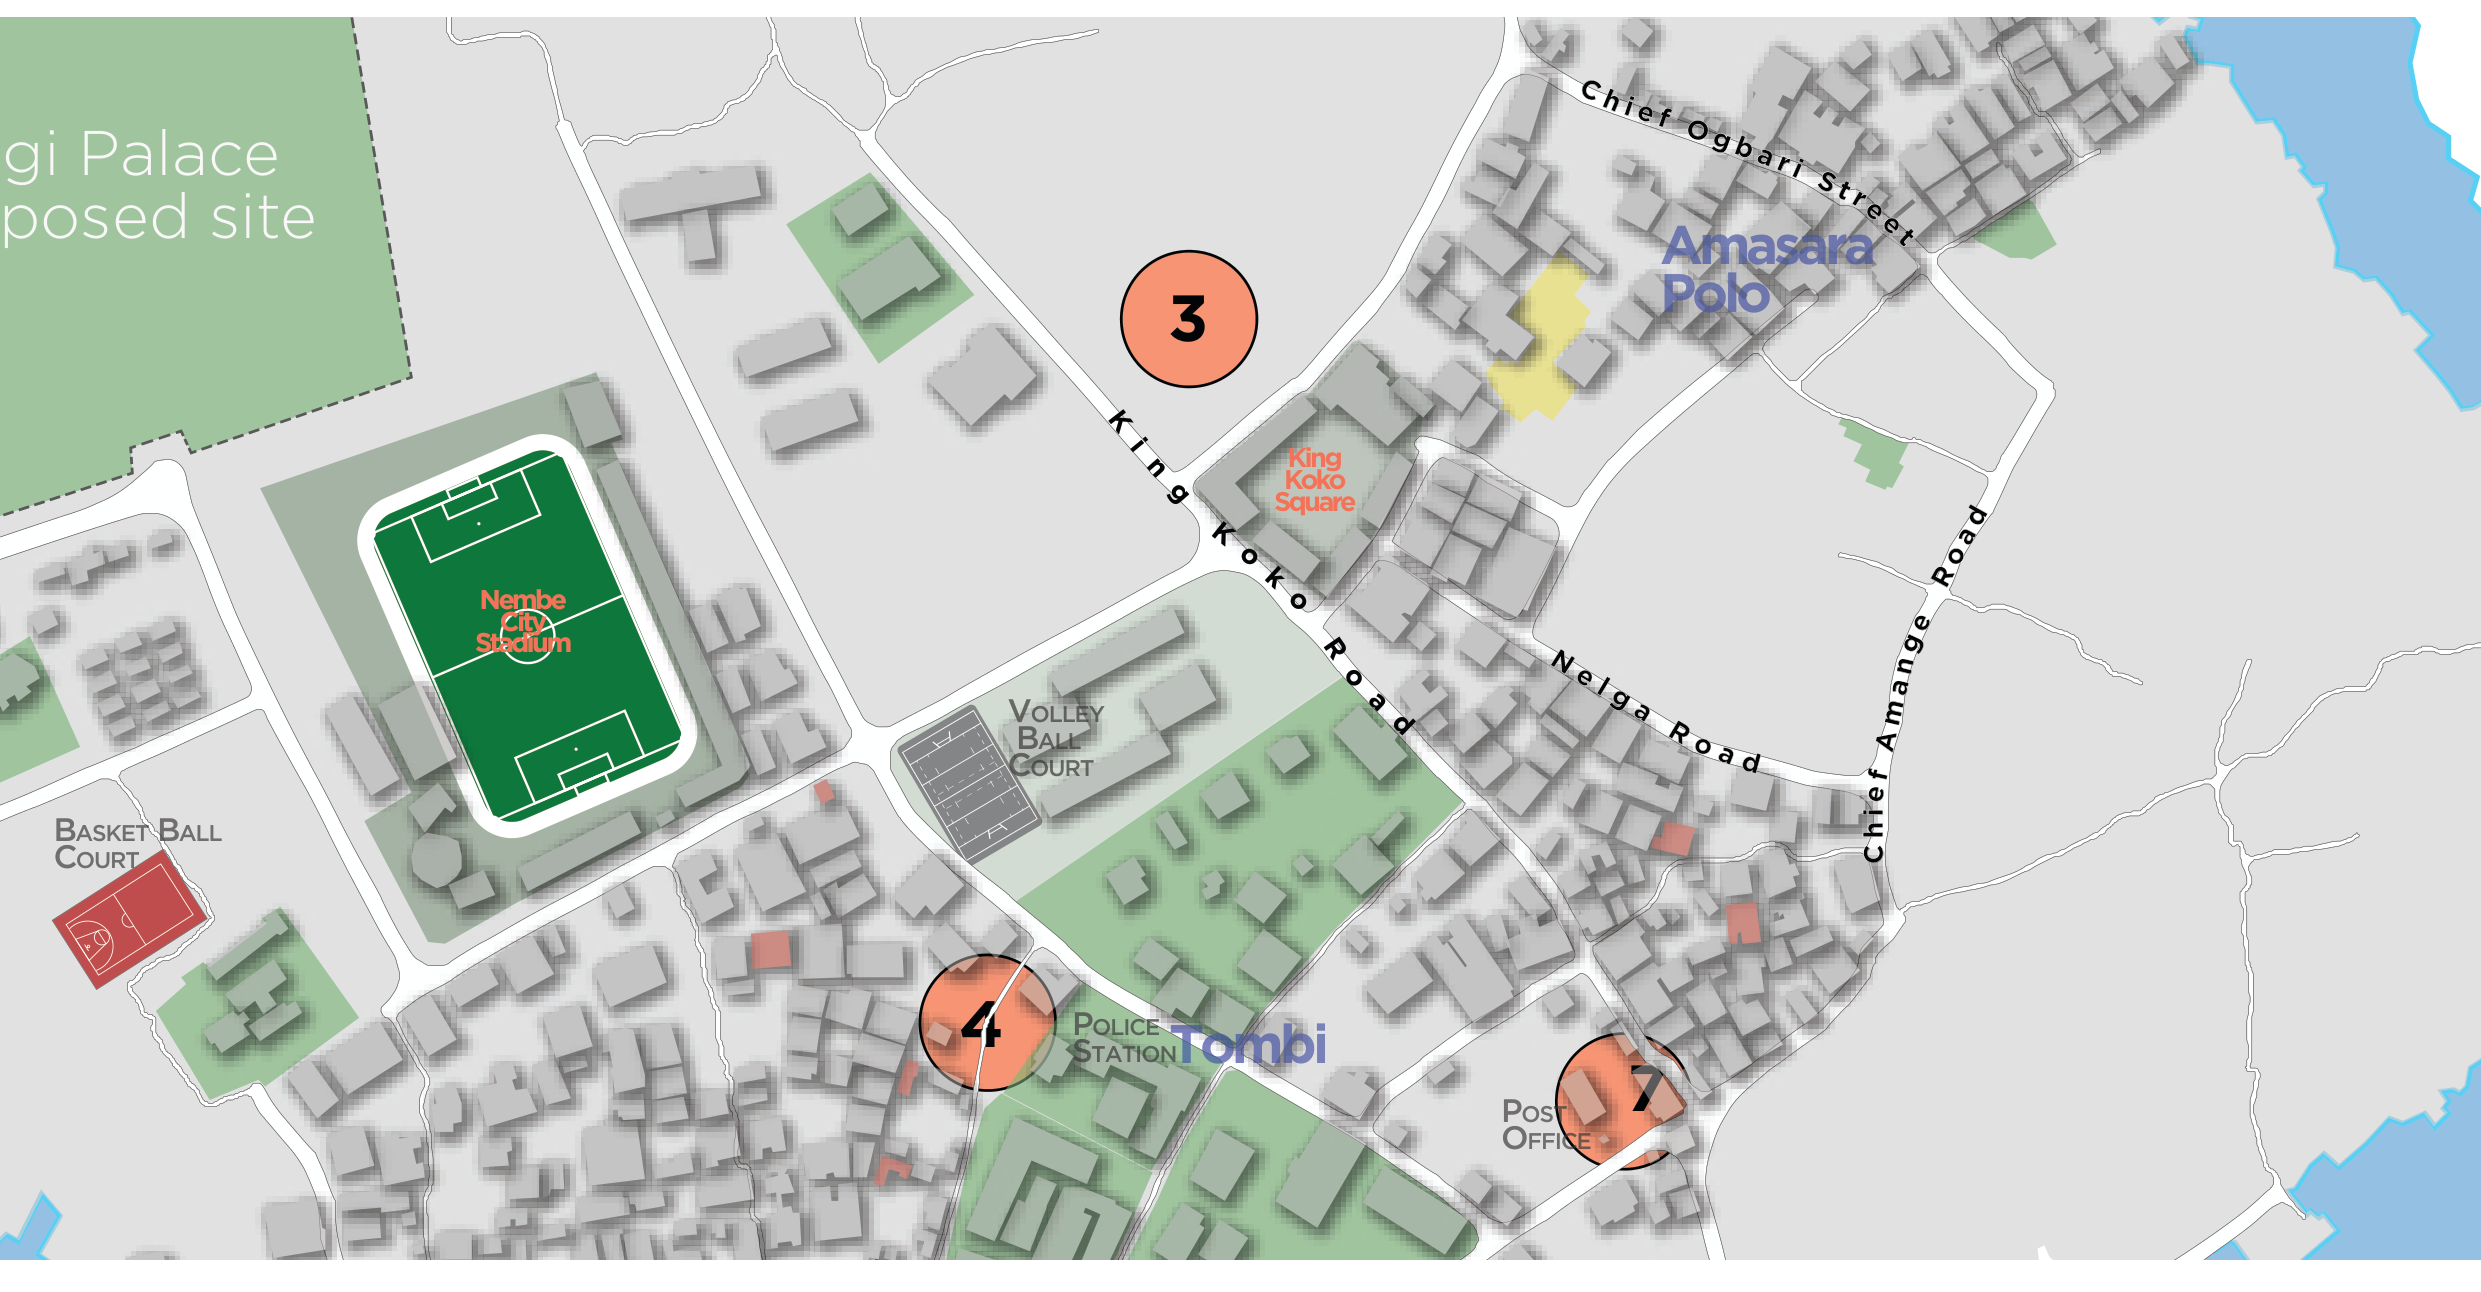
Pro-bono community mapping of landmarks, public facilities and points of interest on Nembe Island.
Geospatial support to environmental impact management following the KS Endeavor incident at Koloama.